Visualizing COVID-19 data: Learning Observable and Vega
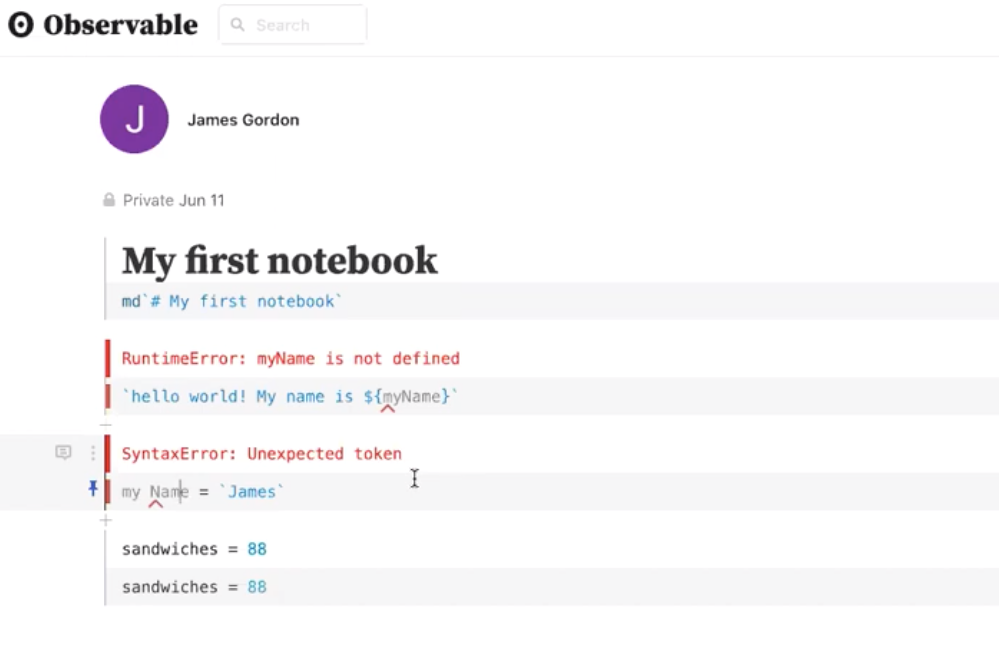
Last week we held a two-day workshop to teach Observable and Vega. Above is day one of the workshop and here is day two. In addition to the videos, explore the notebooks here.

Last week we held a two-day workshop to teach Observable and Vega. Above is day one of the workshop and here is day two. In addition to the videos, explore the notebooks here.
Follow RJI